Analytics & Reporting
Statistics
All data on Olivia is updated in real time. This means that you can see the current status of your project at any time. You can see how many respondents have already been recruited, how many respondents have already participated and how many respondents are still needed to reach your target.
Tip: Hover the info icon next to each headline to see a quick definition of the metric.
Overview
The Overview section gives you a quick read of progress and activity so you can spot momentum, gaps, and risks without digging into tables.
Overall status
Shows total booked respondents versus total invitations across all products. This is your fastest indicator of whether recruiting is keeping pace with outbound invitations.
Recruitment Timeline
Shows bookings over time grouped by product. Use this to identify spikes or slowdowns in recruiting, and to compare which products are moving faster. Cancelled respondents are excluded so the trend reflects real recruiting progress.
Mode mix over time
Shows bookings over time grouped by mode to highlight channel mix changes. This helps you see whether recruiting is shifting between channels (for example, moving from focus groups to IDIs) and whether any mode is underperforming.
Products (Current / Gross)
Compares current booked respondents versus gross invitations for each product. Use this to compare performance across products and to spot products that are falling behind or over-recruiting.
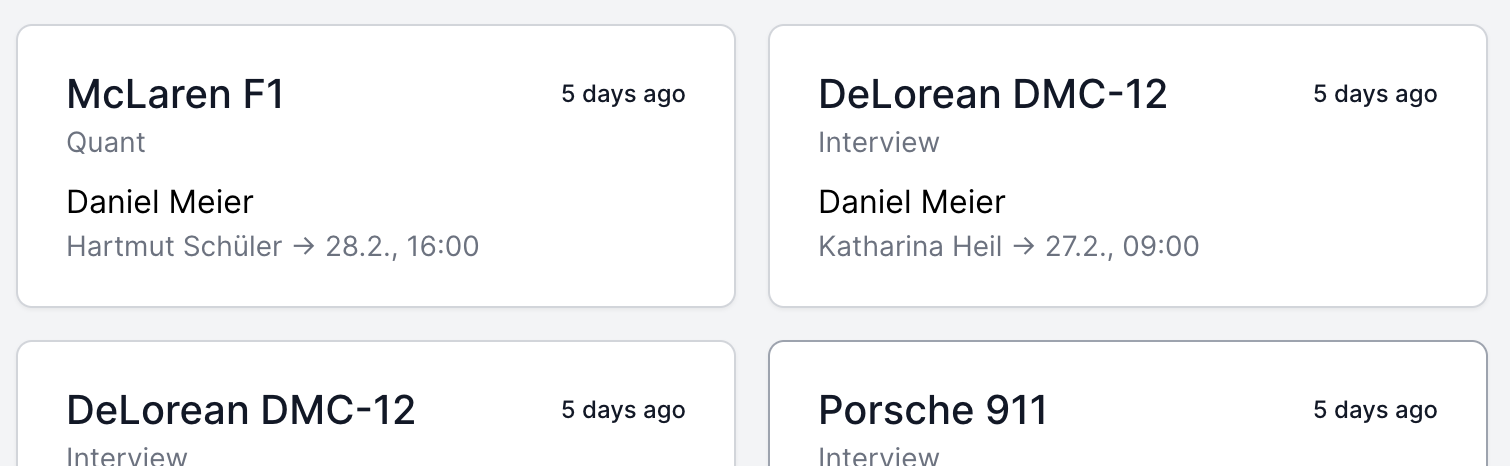
Latest Invitations
You will be shown the 10 latest invitations. You can see the name of the respondent, the date of the appointment and the status of the respondent.
Recruiting efficiency
This section focuses on speed metrics that show how fast respondents are booked and how far in advance sessions are scheduled. It is useful for staffing, clinic scheduling, and identifying bottlenecks in the recruiting workflow.
Time to book (days)
Average and median days between respondent creation and booking. A rising value means that prospects are taking longer to commit, which can signal survey fatigue, messaging issues, or insufficient follow-up.
Lead time to session (days)
Average and median days between booking and the scheduled session date. Short lead times can create last-minute risk, while long lead times can increase no-shows.
Recruiter throughput
Shows bookings per recruiter with a show-rate trend, plus a leaderboard for top recruiters. Use this to understand individual throughput and whether show rates are consistent across the team.
Target forecast
Projects when your target will be reached based on recent booking pace (7-day and 14-day averages). This helps you estimate if additional recruiting effort is needed to hit the deadline.
Recruiting Status
You will see how many respondents have already been recruited and how many respondents are still needed to reach your target. The percentage shows you how many percent of the respondents have already been recruited. FG stands for focus group, IDI for in-depth interview and Quant for quantitative survey.
Use this table as your detailed recruiting scoreboard. It breaks down each product by target, gross invitations, current recruits, and mode-specific counts so you can immediately see which product needs attention. The Open column shows how many slots are still available, which helps you decide whether to increase outreach or reallocate recruiter time.
| Product | Target | Gross | Current | FG | IDI | Quant | Percentage | Open |
|---|---|---|---|---|---|---|---|---|
| Aston Martin DB5 | 3 | 4 | 4 | 2 | 1 | 1 | 133% | 0 |
| Porsche 911 | 3 | 4 | 1 | 0 | 0 | 1 | 33% | 3 |
Explanation: In this example you can see that 4 respondents have already been recruited for the Aston Martin DB5 (current). 2 respondents are booked for the focus group, 1 respondent for the in-depth interview and 1 respondent for the quantitative survey. So with 4 recruited respondents and 3 are needed to reach the target: 133% of your target quota has already been reached (4/3 = 133%), the percentage of over-recruitments is 33% (4/3 = 133% - 100% = 33%).
If there are cancellations, the status will be updated automatically and you can see the current status of your project at any time.
Clinic Status
The clinic status will show you the live status of your clinic. This is extremely useful during an ongoing project. You can see how many respondents have already participated and how many respondents are still needed to reach your target. The chance percentage shows you how likely it is that you will reach your target. The higher the percentage, the more likely it is that you will reach your target.
This view is the operational control center for the day-of clinic. It separates Show, No Show, Screened Out, and Open so you can assess both risk and remaining capacity in real time. If the chance percentage is low for a product, you may need to add last-minute recruiting or reassign open slots.
| Product | Target | Gross | Current | Show | Show % | No Show | No Show % | Open | Chance in % |
|---|---|---|---|---|---|---|---|---|---|
| Aston Martin DB5 | 3 | 5 | 5 | 0 | 0% | 0 | 0% | 5 | 167% |
| Porsche 911 | 3 | 5 | 5 | 3 | 100% | 0 | 0% | 2 | Target reached (+0) |
Explanation: For the Aston Martin DB5, 5 respondents have been recruited (current). None of the respondents have participated or NOT participated yet. So with 5 recruited respondents still to be 'open' and 3 are needed to reach the target: The chance is 167% that you will reach your target (5/3 = 167%).
For the Porsche 911, 5 respondents have been recruited (current). 3 respondents have already participated, so the target has already been reached and at the moment you have 0 over-recruitments (target reached (+0)). If the 2 open respondents participate, you will have 2 over-recruitments (target reached (+2)).
Again, all data is updated in real time.
Screened Out Respondents
If there are any respondents that are screened out, an additional "Screened Out" column (and percentage) will automatically appear in the clinic statistics table. If there are no screened out respondents, this column will be hidden. This ensures the table only shows relevant data for your project.
Example: A respondent might be screened out if they do not meet the required criteria for the study, such as not passing a qualifying question during the screening process, or if they fail an on-site check-in (e.g., not bringing required documents or identification).
Related
- Dashboard — the central hub for managing day-to-day operations
- Products — quotas and targets that statistics track
- Check-in — clinic status reflects check-in data in real time
- Excel Export — export all data for offline analysis
- Glossary — definitions of terms used in statistics